

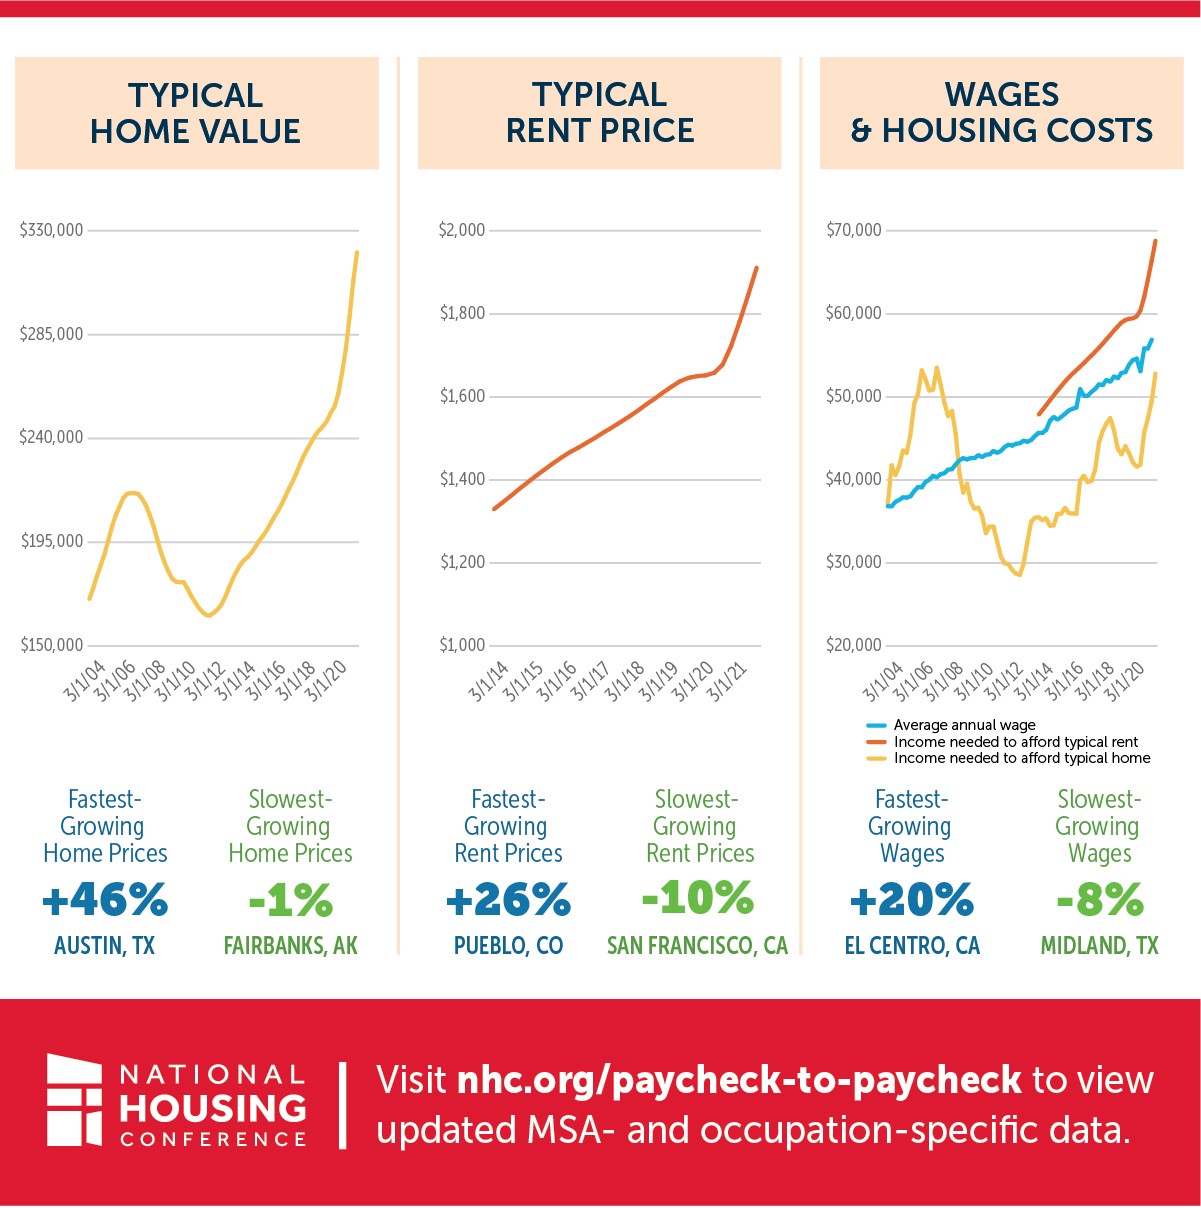
The P2P database illustrates the ability of a wide range of occupations to afford typical housing in metropolitan areas across the country.
“Priced Out: When a good job isn’t enough”
(October 2026)
Across the country, rising housing costs are making it increasingly difficult for workers to afford a home in the communities where they live and work. NHC’s second annual Priced Out: When a Good Job Isn’t Enough report takes a closer look at this growing affordability gap, revealing how dramatically access to homeownership has changed over the past five years. The report explores what this means for America’s workforce and local economies as the dream of homeownership moves further out of reach for millions of Americans.
Findings show that:
- Homeownership affordability has fallen sharply: Affordable occupation–metro combinations dropped from 32,794 in 2020 to 12,189 in 2025, while workers in 188 metro areas now need at least twice the income to afford a typically priced home.
- Renters are losing ground, too: Nearly half of tracked occupation–metro combinations could not afford a two-bedroom rental in 2025, while 38 metro areas required salaries above $75,000 to afford one without being cost-burdened.
- Even higher earners are being priced out: The average salary among occupations that lost the ability to buy was $70,283, while 193 metro areas now require salaries above $100,000 to afford a typically priced home—up from just 30 in 2019.
NHC’s Paycheck to Paycheck database illustrates the ability – or lack thereof – of working families to afford typical housing in metropolitan areas across the country by comparing wage data and housing costs.
We update our database every quarter to keep up with the country’s rapidly changing housing market. In conjunction with these updates, we issue quarterly reports highlighting a different angle of the housing costs facing families across the country. Check out our visualization tool below or download the data yourself to get the latest snapshot of housing affordability across the country.
Paycheck to Paycheck uses three data sources:
- The Bureau of Labor Statistics’ (BLS) Metropolitan Area Occupational Employment and Wage Estimates gives median wage data for several hundred occupations disaggregated by metropolitan area.
- The Zillow Home Value Index gives typical home values for each metropolitan area.
- The Department of Housing and Urban Development’s (HUD) Fair Market Rent metric estimates the 40th percentile gross rent in each metropolitan area.
Using these three sources, we estimate the annual salary needed to afford to sustainably own or rent a home in 390 metropolitan areas, and compare that to the median annual salary for 150 occupations. (Due to regional differences in employment levels, BLS does not provide wage data for certain occupations in certain metropolitan areas. We are unable to compare wage and housing price data for those occupations in those areas.) We assume that rent should represent no more than 30% of one’s gross income, and that costs associated with homeownership should represent no more than 28% of one’s gross income (given the need to be able to pay for unforeseen maintenance costs).
When calculating the salary necessary to afford homeownership in a given metropolitan area, we assume the prevailing annual percentage rate (APR), property taxes equal to 1.1% of the value of the home annually, homeowner’s insurance equal to 0.35% of the value of the home annually, and private mortgage insurance equal to 1% of the value of the home annually.
Our affordability calculations are based on monthly housing costs, principally rent and mortgage payments. They do not account for other barriers to obtaining housing, such as saving up for a down payment, exclusionary zoning that renders neighborhoods near jobs and transit prohibitively expensive, or discrimination.
Job loss, housing composition changes, and personal preferences mean that many households rely on just one income to get by. In recent years, about a third of households in the United States had just one wage earner, and the median number of earners per household is around 1.3.
Reports & Data

Sponsored By